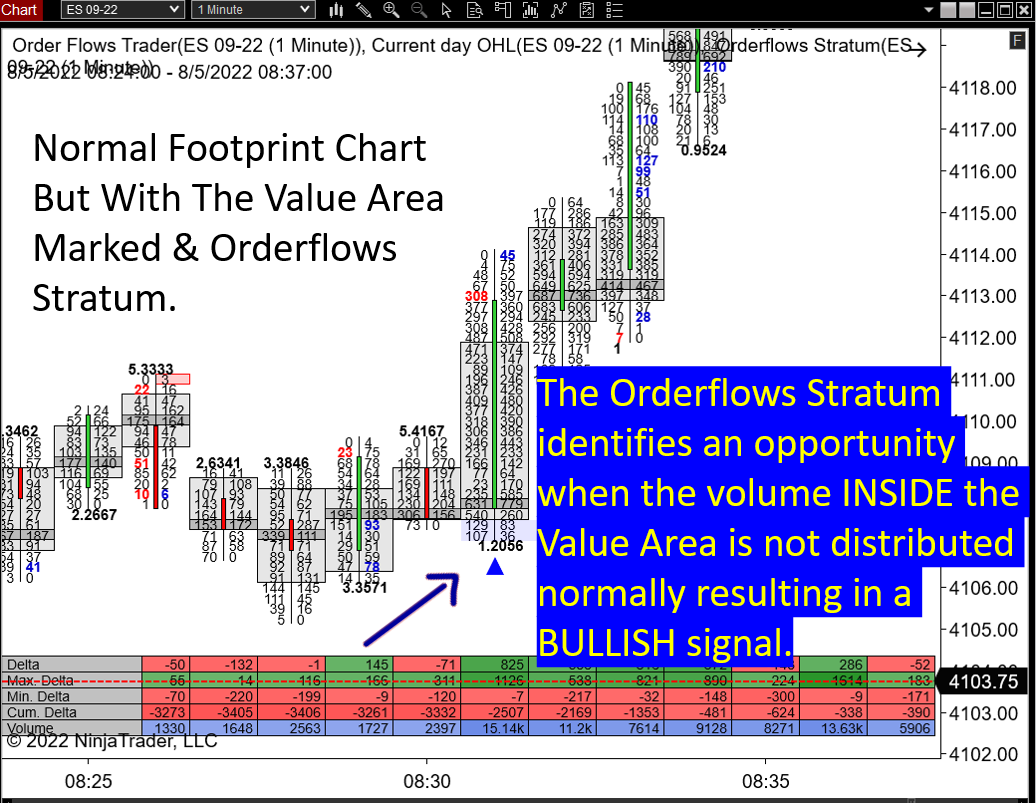
Orderflows Stratum

The Orderflows Stratum will run on your normal candlestick chart. Enabling you to use the Orderflows Stratum with you existing forms of market analysis.
Finally, you will have a way to read one of the most important aspects of order flow without having to read an order flow footprint chart. This is the first tool of its kind.
Harness the power of order flow without needing to monitor every tick that goes through! A problem with a lot of indicators is you often have to curve fit it for your market. In other words, you have to find the best settings that worked in the past and hope they work in the futures. That is a recipe for disaster. Order flow trading is all about making decisions based on current market information. And one of the most important pieces of market information is the Value Area. The Value Area is the range of prices where the majority of trading activity takes place. This is usually determined by looking at the volume of trading activity over a certain period of time, such as a day or hour or 30 minutes or even 1 minute periods . When the volume is not distributed properly within the Value Area, it can create opportunities for traders. If you can identify these opportunities, you can potentially make a lot of money. So it's important to understand the Value Area and how it works.
Analyzes the volume in the Value Area
Identifies those Value Areas with weaker volume
Identifies those Value Areas with stronger volume
Identifies those areas within Value Area where volume is unevenly distributed
Allows you to understand the trading environment better
Runs on your normal candlestick chart